FINDING THE TURN AROUND POINTS
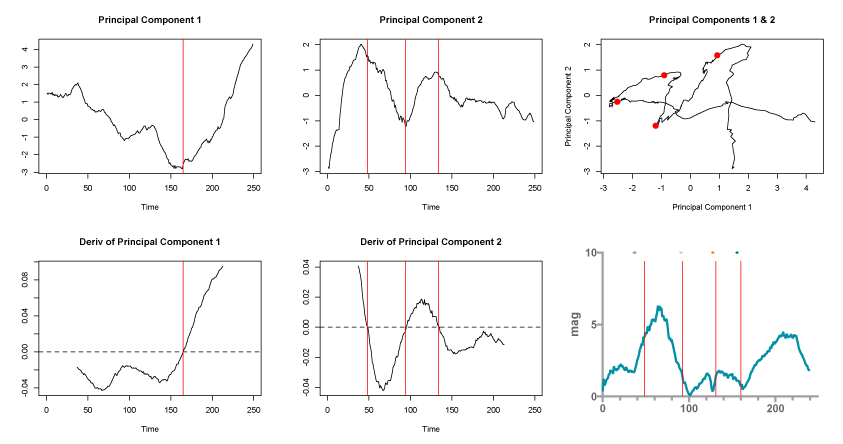
I used principle component analysis to reduce the dimensions of the path to a 2D data set. I then used a Savitzky–Golay filter to find the first derivative (charts 1-5). I overlaid that data on the vector magnitude over time. The colored dots above the red dots are where I determined the turn around points where by eye.
I used principle component analysis to reduce the dimensions of the path to a 2D data set. I then used a Savitzky–Golay filter to find the first derivative (charts 1-5). I overlaid that data on the vector magnitude over time. The colored dots above the red dots are where I determined the turn around points where by eye.
FINDING THE PROTRUSIONS
|
Video showing vector from actin center of mass to membrane center of mass over time. The magnitude of the vector is displayed by the size of the bar along the bottom. This vector seems to correspond to periods of movement with high directionality. The magnitude plotted over time is shown above in blue, while the red lines are a computational approach to define turn around points.
password: cell14 |
|
I did the magnitude analysis on cell 15 as well, and there is a similar result: High vector magnitude corresponds to high directionality of protrusions. Low magnitude vector corresponds to protrusions in all directions. Below are the min and max structures: the min structure is simultaneously pulling in protrusions while extending two new bumps on the back. Overall I think this is consistent with protrusions being important for environment interrogation, (possibly both spacial and chemical composition) and not for movement.
password: cell15
password: cell15
|
|
Iso surface of a membrane tagged HL60 cell crawling through collagen (not shown). Video produced in Hydra, at 16x realtime. Data collected by Lillian Frtiz-Laylin.
|
|
|
HL60 cell (red) crawling through collagen (green). Video produced in Cinema4D.
|
