Purpose |
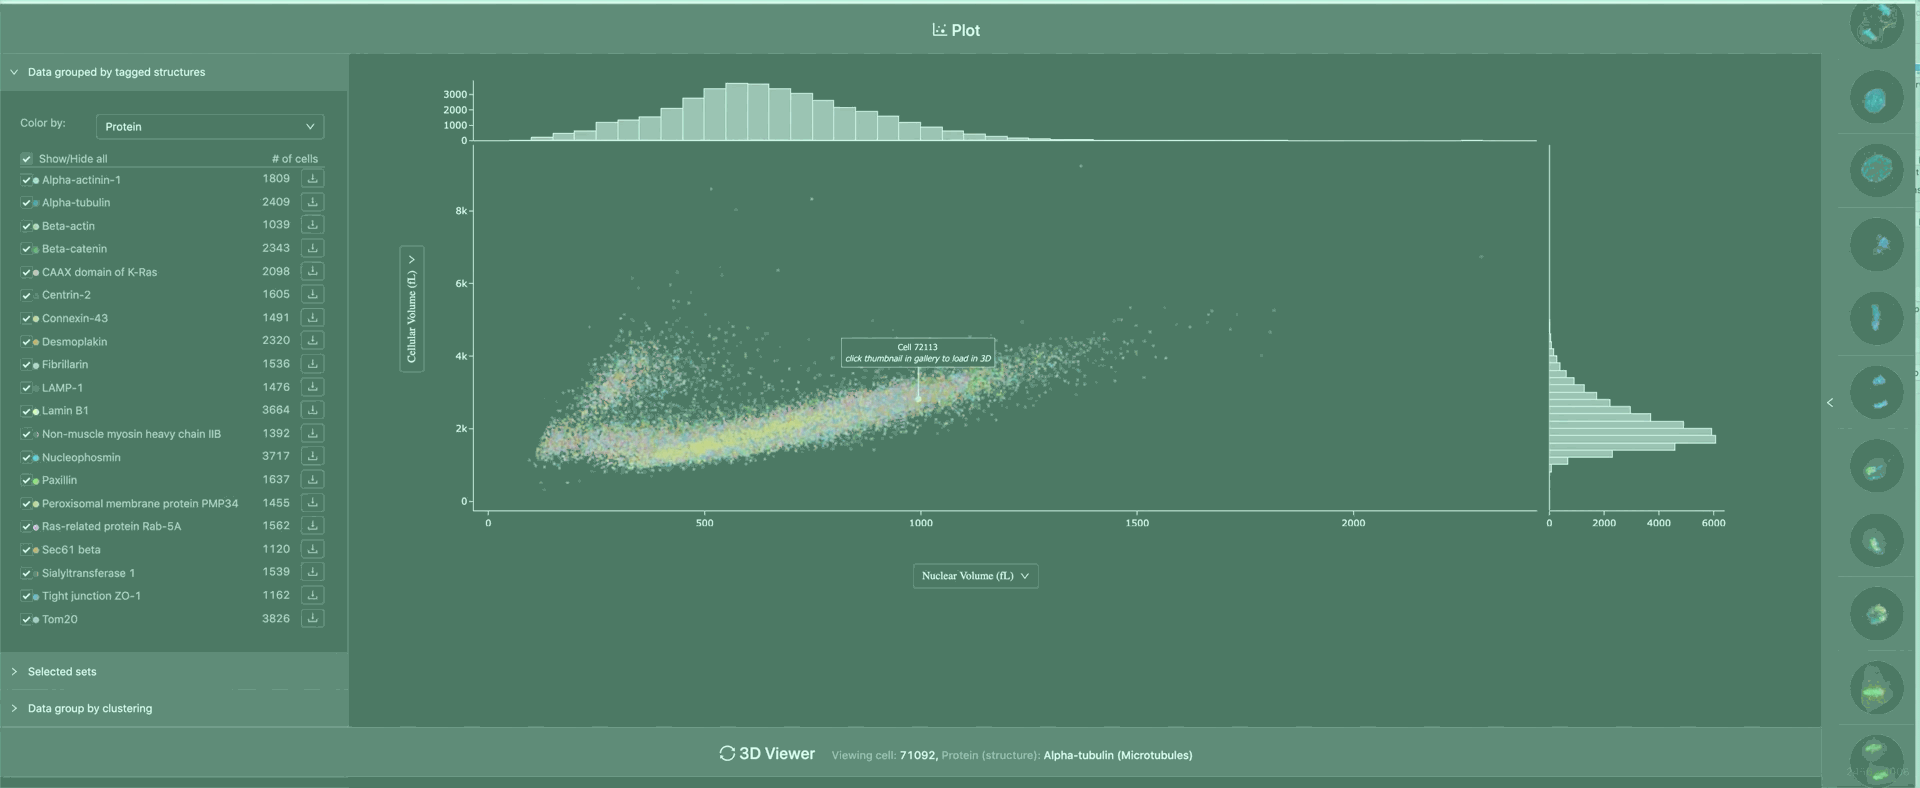
We have a catalog of over 30,000 individually segmented images of stem cells, and for each we've measured features like cellular volume and nuclear volume. We want other researchers to be able to explore and download our data. This new tool is an analysis first version, where the user can plot the cells by different parameters, select a subsection of cells, download them, and view them in 3D.
We've currently released over 4 datasets, and are continuing to expand the data and functionality. |
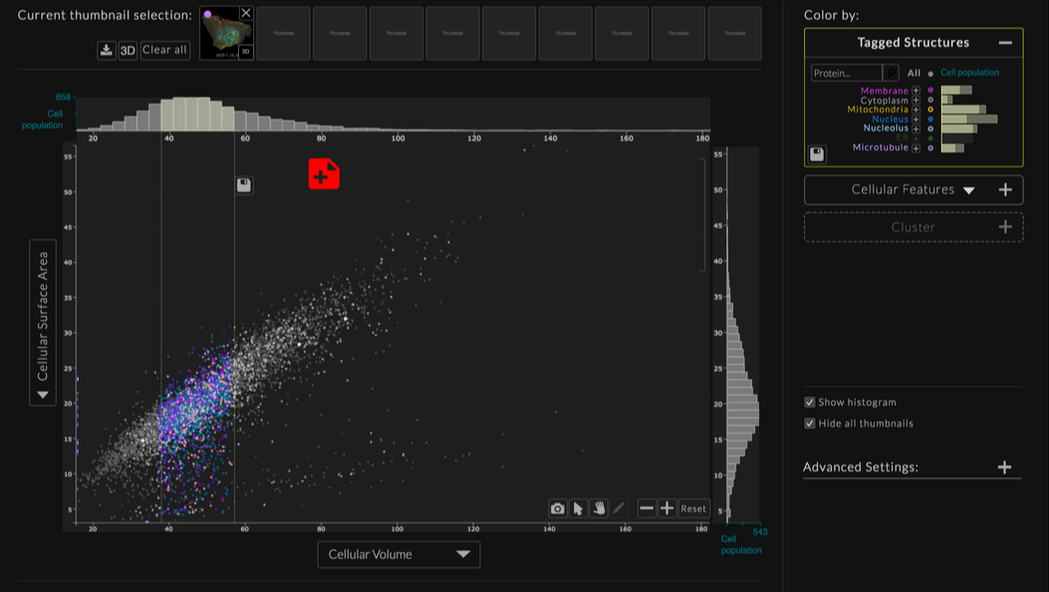
Early VersionOur first version of the 3D viewer had a plot as a side panel, but the main view was a gallery of images. Once our library got larger, navigating by a chart seemed to be more useful than by paging through thousands of images.
|
|
DesignWe used moqups to create an interactive prototype and tested it internally with other people at the Allen Institute to find out what features researchers would want and how to make them user friendly.
|
|
Development
The data that drives the app is processed through Github actions and uploaded to a Firebase Firestore database. I created and continue to develop the front end using TypeScript, React and Redux. I also wrote the scripts to process and upload the data, working with the dataset creators to streamline the publication process.
The 3D viewer is an npm installable web application that wraps our WebGL volume viewer. The core of it was developed by our graphics senior software engineer.
The 3D viewer is an npm installable web application that wraps our WebGL volume viewer. The core of it was developed by our graphics senior software engineer.